
The Drift Imperative: Models Decay Without Monitoring
AI systems are never static. Performance degrades, data drifts, and user expectations evolve. Models left unchanged for extended period experience substantial error rate increases. A model that was accurate on training data can become unreliable as the world changes around it. This happens not through any code change, but through the slow drift of input distributions, user behaviour, and upstream data sources.
The model is only one component of a socio-technical system that includes data pipelines, retrieval mechanisms, user populations, and external APIs. Any of these can shift without warning.
Drift detection is not a monitoring feature. It is an operational necessity.
Investigation 3: Drift Detection & Performance Monitoring
Core Mandate
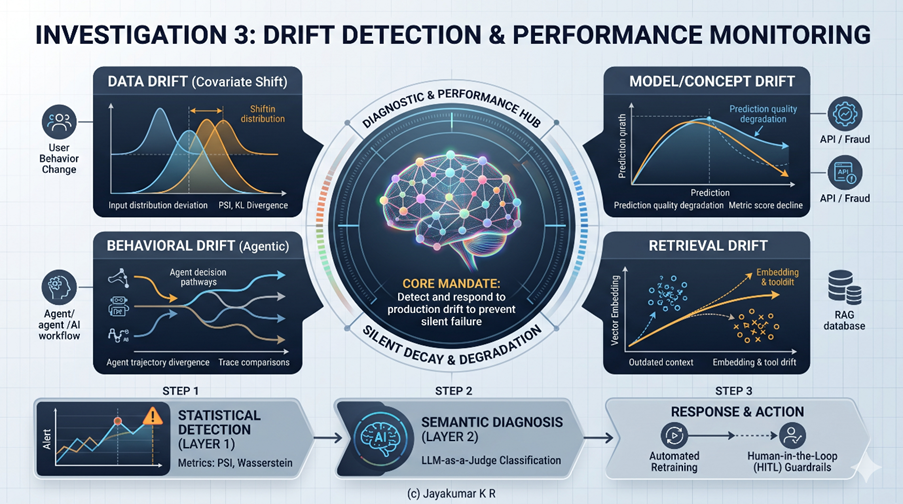
Detecting and responding to drift in production. This investigation owns the operational detection of drift and the connection to retraining triggers.
Why This Investigation Matters for Project Leaders
A model that drifts undetected is a model that fails silently. The failure does not manifest as an exception or a timeout. It manifests as a slow erosion of quality: slightly less relevant recommendations, slightly less accurate predictions, slightly more hallucinations, slightly higher costs. Much like the proverbial frog that remains in water as it is heated gradually, gradual degradation is easy to ignore until the damage becomes too significant to reverse. By the time these failures surface in user complaints or business metrics, the impact has already accumulated.
Drift detection is the mechanism that converts silent degradation into actionable signal. It is the difference between discovering a problem in production and discovering it in a post-mortem.
This investigation addresses two fundamental management questions. Do we have the operational detection in place to know when our AI system has drifted from its validated baseline? Is that detection connected to a response?
What to Investigate
1. The Four Types of Drift
Drift is not a single phenomenon. AI systems can drift in four distinct ways, each requiring different detection methods and different responses.
1.1 Data Drift (Covariate Shift)
The distribution of input data deviates from the training or evaluation data distribution.
Causes:
- User behaviour changes seasonally (e.g., holiday shopping patterns)
- New product features attract different user segments.
- Marketing campaigns bring unexpected query patterns.
- Upstream data pipelines change their output distributions.
- External events shift the context in which the model operates.
Example: A customer lifetime value model trained on pre-pandemic data encounters radically different purchasing patterns during and after the pandemic.
Detection: Statistical comparison of production input distributions against a reference baseline. Commonly used metrics include Population Stability Index (PSI), Kullback-Leibler divergence, and Jensen-Shannon divergence.
System-specific considerations:
- Traditional ML: Feature-level drift detection. Monitor each input feature for distribution shift.
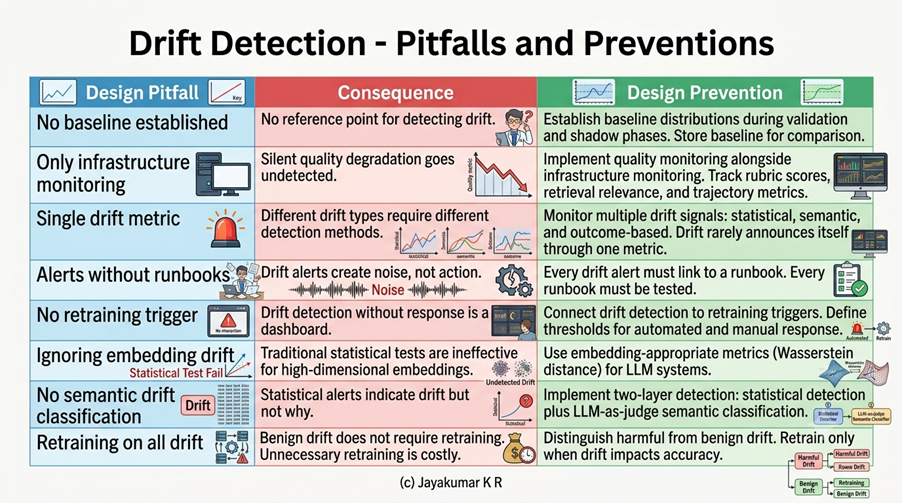
- GenAI/LLM: Prompt drift. Monitor the semantic content of user queries. Embedding-based drift detection using distance metrics like Wasserstein distance can be effective than traditional statistical tests for high-dimensional LLM embeddings.
- Agentic AI: Input drift at each agent step. The distribution of tool call inputs, planning contexts, and memory retrieval queries can all drift independently.
1.2 Model Drift (Concept Drift)
Degradation in the underlying model’s intrinsic quality or behaviour. The relationship between inputs and outputs changes.
Causes:
- For API-based systems, providers may update models without announcement.
- For self-hosted models, the model’s parameters “age” as real-world patterns evolve.
- The concept being predicted changes meaning (e.g., what constitutes “fraud” evolves over time)
Example: A fraud detection model trained on historical fraud patterns fails to detect new fraud techniques that did not exist in the training data.
Detection: Monitor prediction quality metrics against delayed ground truth. Track prediction distribution shifts. For GenAI systems, track rubric scores (Groundedness, Relevance, Coherence, Safety) over time.
System-specific considerations:
- Traditional ML: Accuracy, precision, recall, RMSE against delayed labels. Prediction distribution monitoring.
- GenAI/LLM: Rubric score degradation. Output consistency changes. Safety flag rate increases.
- Agentic AI: Task completion rate degradation. Containment (1 − False Resolution) decline. Trajectory quality changes.
1.3 Retrieval Drift (RAG Systems)
In RAG systems, the vector database returns irrelevant, incomplete, or outdated context.
Causes:
- Document collections become stale.
- Embedding models fail to represent new query patterns effectively.
- Chunking strategies break on unforeseen edge cases.
- New documents are added that conflict with existing knowledge.
- The vector index becomes corrupted or misaligned.
Example: A customer support RAG system retrieves outdated policy documents after a policy change, generating responses that contradict current policy.
Detection: Monitor retrieval relevance scores. Track the semantic similarity between retrieved documents and user queries. Monitor the distribution of retrieved document IDs over time.
System-specific considerations:
- GenAI/RAG: Embedding drift detection. Retrieval relevance evaluation. Arize Phoenix visualizes high-dimensional embedding vectors using UMAP projection. This allows engineers to literally see when production embeddings drift from the golden dataset cluster.
- Agentic AI: Tool selection drift. Monitor whether the agent selects the correct tools for given tasks. Track tool call accuracy over time.
1.4 Behavioural Drift (Agentic Systems)
Definition: The agent’s behaviour changes in ways not captured by other drift types. The agent takes different trajectories, uses different tools, or exhibits different reasoning patterns.
Causes:
- Memory state accumulation alters agent behaviour.
- Tool availability or response formats change
- Prompt configuration drifts through accumulated edits.
- Multi-agent interaction patterns evolve.
Example: An agent that previously completed tasks in 3 steps now takes 7 steps due to changed tool response formats. This increases latency and cost without triggering traditional alerts.
Detection: Trajectory-level monitoring. Compare current agent trajectories against historical baselines. Track step count, tool call patterns, and reasoning path distributions.
System-specific considerations:
- Agentic AI: This is the drift type unique to agentic systems. It requires trajectory-level observability (from Investigation 2) and comparison against historical execution traces. AgentTrace provides structured logging across operational, cognitive, and contextual dimensions to enable this comparison.
1.5 Multimodal Drift (Multimodal Systems)
Multimodal AI systems which process text, images, audio, and video simultaneously introduce drift dimensions that single-modality systems do not face. A multimodal embedding space must maintain alignment across modalities.
Key detection considerations:
- Cross-modal alignment drift: Monitor the distance between paired embeddings (e.g., image-text pairs) over time. A widening gap signals that the shared representation space is degrading.
- Modality-specific drift: Each modality carries its own drift profile. Audio may drift due to microphone or environmental changes; images due to compression or lighting; text due to vocabulary shifts. These must be monitored independently before assessing cross-modal impact.
- Multimodal embedding metrics: Standard statistical tests (PSI, KS) are ineffective for high-dimensional multimodal embeddings. Wasserstein distance or alignment-specific metrics can capture directional shifts in the shared space.
- Graceful degradation: Multimodal systems should be designed so that if one modality fails or drifts significantly, other modalities maintain functional output. Monitor modality availability and contribution weights.
2. Drift Detection Indicators: Standardisation Across Teams
Drift detection requires standardised indicators to enable cross-team comparison and aggregated monitoring. The following are industry standards for drift detection.
2.1 Population Stability Index (PSI)
Measures the shift in distribution of a variable between two samples (typically training vs. production).
Interpretation:
- PSI < 0.1: Stable distribution — no action required.
- PSI 0.1–0.25: Moderate shift — investigation warranted.
- PSI > 0.25: Notable shift — action required.
Applicability: Traditional ML feature monitoring. Less effective for high-dimensional embedding spaces where individual dimensions are less meaningful.
2.2 Kullback-Leibler (KL) Divergence
Measures the difference between two probability distributions. The divergence from P to Q is different from Q to P, which is asymmetric.
Applicability: Distribution comparison for tabular features and prediction outputs.
2.3 Jensen-Shannon Divergence
A symmetric measure of distribution similarity. Bounded between 0 and 1 (when using base 2 logarithm).
Applicability: Google Cloud Model Monitoring supports Jensen-Shannon divergence for both categorical and numerical input features.
2.4 Wasserstein Distance
Definition: Measures the “earth mover’s distance” between two distributions. More effective than KL divergence or PSI for high-dimensional embedding spaces.
Applicability: LLM embedding drift detection. AWS prescriptive guidance recommends Wasserstein distance for generative AI use cases. Traditional metrics like Kolmogorov-Smirnov are less effective for multi-dimensional LLM embeddings.
2.5 Kolmogorov-Smirnov (KS) Test
Definition: Non-parametric test of whether two samples come from the same distribution. Returns a p-value.
Applicability: Traditional ML feature drift for low-dimensional data. Less effective for high-dimensional embeddings.
2.6 Feature Importance Shifts
Changes in which features drive predictions. Measured via SHAP values or feature attribution methods.
Applicability: Google Cloud Model Monitoring tracks feature attribution changes using SHAP values. A change in a key feature’s attribution score often signals a change in that feature. This change may impact model accuracy.
2.7 Prediction Distribution Changes
Definition: Shifts in model outputs over time. The distribution of predictions (classification probabilities, regression values, generated text embeddings) changes even when inputs appear stable.
Applicability: All AI system types. Particularly valuable when ground truth is delayed.
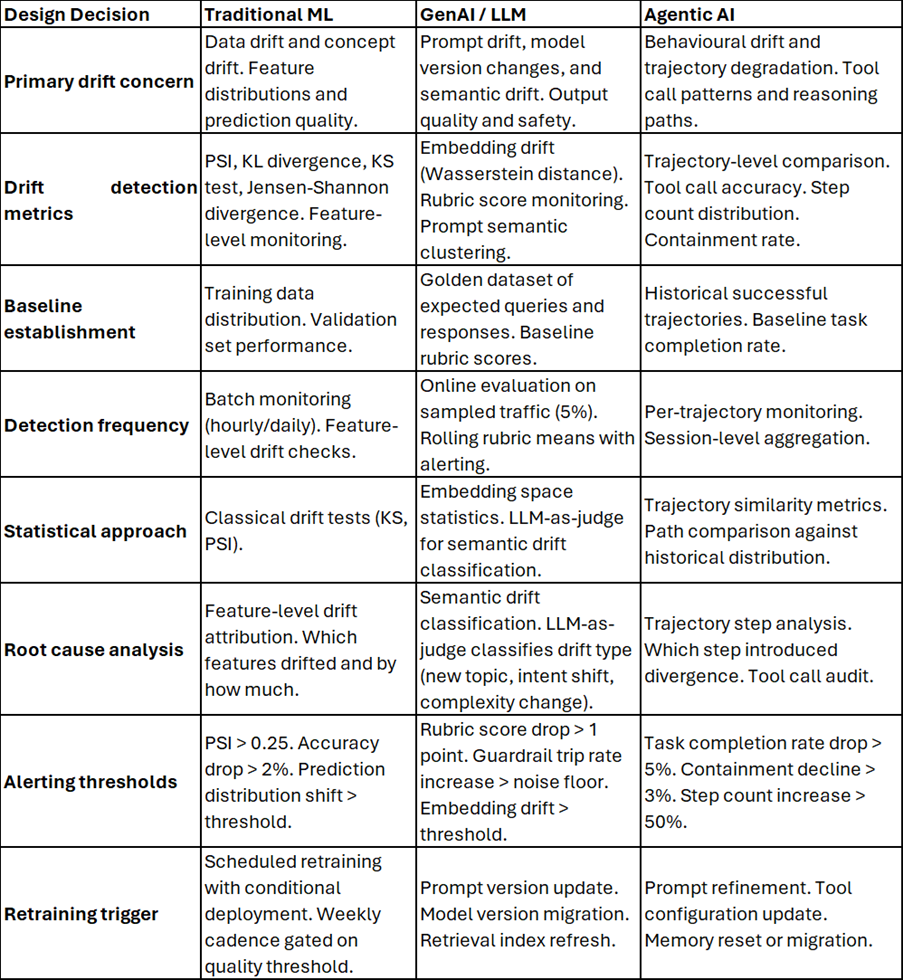
3. Drift Detection by System Type: Traditional ML, GenAI, and Agentic AI
The four drift types apply across all AI systems, but the detection mechanics can differ.
4. From Detection to Response: The Retraining Trigger Pattern
The value of drift detection lies in its connection to action.
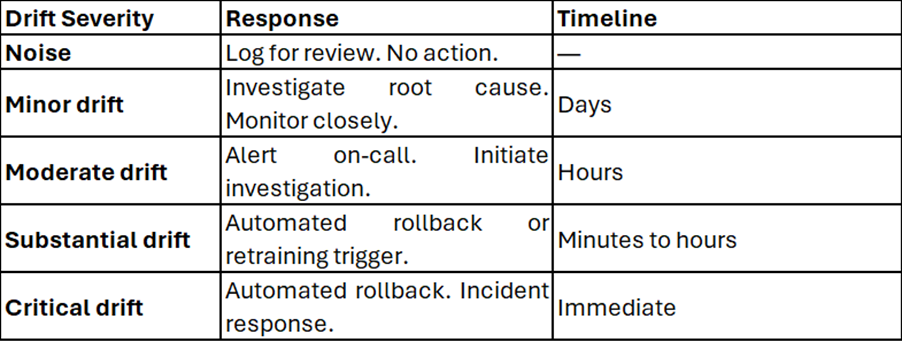
4.1 The Detection-Response Pipeline
A complete drift detection system has four components:
- Detection: Statistical or semantic identification of drift
- Classification: Determining the type and severity of drift
- Decision: Determining the appropriate response (ignore, investigate, retrain, rollback)
- Action: Executing the response
4.2 Response Options
4.3 Automated Retraining
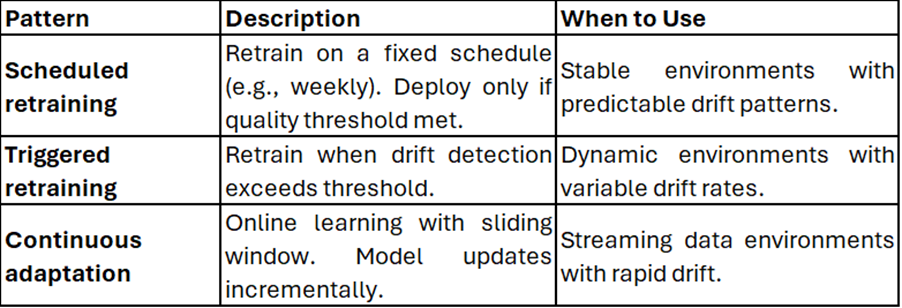
Scheduled automated retraining is a reasonable starting point for drift response. A weekly cadence with conditional deployment is one option. Deployment is gated on a quality threshold, which balances responsiveness against cost.
Retraining patterns:
The SCCM (Stream Cruise Control Method) approach represents a meta-adaptive layer. It monitors predictive performance, estimates drift severity, and adjusts model hyperparameters within bounded limits. It distinguishes between hyperparameters (model-specific learning dynamics) and configuration parameters (deployment-time operational preferences), enabling tuning-free adaptation.
Research on harmful vs. benign drift suggests that not all drift requires retraining. Some distribution shifts do not degrade model accuracy. The approach of identifying Data Distributions with Low Accuracy (DDLAs) enables distinguishing between harmful drift and benign drift. Harmful drift requires retraining; benign drift does not. This reduces unnecessary retraining costs.
4.4 Runbooks for Drift Response
Every drift alert must link to a runbook that defines:
- Trigger: What threshold was breached?
- Investigation steps: How to diagnose the drift?
- Decision criteria: What constitutes actionable drift?
- Response options: Rollback, retrain, investigate?
- Communication plan: Who needs to know?
- Validation: How to confirm the response resolved the issue?
A drift alert without a runbook creates noise, not action.
4.5 Human-in-the-Loop for Drift Response
Human-in-the-loop (HITL) checkpoints ensure that high-risk or ambiguous drift events receive human judgment before automated actions (retraining, rollback) execute.
When HITL is essential:
- Ambiguous drift signals: When statistical detection fires but the semantic classifier cannot confidently categorize the drift type, human review prevents misdirected retraining.
- High-cost responses: Retraining a large model is expensive. HITL approval gates ensure retraining only occurs when drift is confirmed harmful.
- Threshold adjustment: If drift detectors are producing frequent false positives, human feedback should adjust sensitivity, either globally or per-metric.
- Novel drift patterns: When the semantic classifier encounters a drift type it has not seen before, human classification provides the training signal for future automated categorization.
HITL architecture patterns:
- Alert → Human Review → Decision → Action: The drift alert triggers a review workflow; a human reviews the evidence package (statistical signals + semantic classification + root cause analysis) and approves, modifies, or rejects the proposed response.
- Feedback loop: Human decisions (confirmed drift vs. false positive) feedback to refine detector thresholds and classifier training data.
- Escalation paths: Define which drift severities require human approval before action, and which can proceed automatically.
Automation bias mitigation:
Humans may over-rely on automated recommendations even when their own judgment suggests otherwise. Provide interfaces that encourage information verification rather than blind acceptance.
4.6 Alert Triage and Prioritization
When drift detection is operating across multiple systems, models, or features, alert volume can quickly exceed response capacity. Engineers feel alert fatigue and begin ignoring alerts due to volume. The solution is automated triage that scores and prioritizes alerts before they reach human responders.
Triage scoring dimensions:
- Incident likelihood: Is this a real problem or noise? AI triage agents assess whether an anomaly represents a genuine drift event or a statistical fluctuation.
- Downstream blast radius: If the drift is real, what is the potential impact? Triage scores consider asset criticality, number of affected users, and dependency chains.
- Signal corroboration: Alerts that cluster around the same asset, user, or time window are elevated; isolated low-severity alerts are deprioritized.
Routing logic:
- High-priority alerts → on-call channel, immediate investigation
- Medium-priority alerts → team channel, investigate during business hours.
- Low-priority alerts → logged for batch review, no immediate action.
Dynamic re-scoring:
Alert priorities should not be static. As new related anomalies arrive, the triage score should be reassessed. An alert initially scored Low may escalate to High if corroborating signals accumulate.
5. Performance Monitoring: Beyond Drift
Drift detection is one component of performance monitoring. A complete performance monitoring system tracks:
5.1 Prediction Quality Metrics
- Traditional ML: Accuracy, precision, recall, F1, RMSE (when labels available). Confidence calibration.
- GenAI/LLM: Per-rubric scores (Groundedness, Relevance, Coherence, Safety). Hallucination rate. Guardrail trip rate.
- Agentic AI: Task completion rate. Containment (1 − False Resolution). Tool call accuracy. Trajectory efficiency.
5.2 Latency Metrics
- Traditional ML: p50/p95/p99 inference latency.
- GenAI/LLM: Time-to-first-token (TTFT). Time-per-output-token (TPOT). Total generation time.
- Agentic AI: End-to-end trajectory time. Per-step latency. Tool call latency.
5.3 Throughput and Error Rates
- Traditional ML: Predictions per second. Error rate by error type.
- GenAI/LLM: Tokens per second. API error rate. Rate limiting frequency.
- Agentic AI: Tasks per hour. Tool call error rate. Loop detection trigger rate.
5.4 Resource Utilisation
- Traditional ML: CPU/GPU utilisation. Memory usage. Batch efficiency.
- GenAI/LLM: GPU utilisation. KV cache utilisation. Memory bandwidth. Queue depth.
- Agentic AI: Multi-container resource usage. Agent loop resource consumption. Tool execution resource usage.
6. The Two-Layer Drift Detection Pattern
Advanced drift detection systems employ a two-layer approach: statistical detection followed by semantic understanding.
Layer 1: Statistical Detection
Statistical methods identify that drift has occurred. They compare distributions and flag deviations that exceed thresholds.
Indicators: PSI, KL divergence, Jensen-Shannon divergence, Wasserstein distance, KS test.
Output: Binary or continuous drift signal with severity estimate.
Layer 2: Semantic Understanding
Statistical alerts indicate that drift happened but not why. LLM-as-a-judge can classify the nature of the drift, providing actionable insights.
Process:
- Sample the drifted data when a statistical alert triggers.
- Use a judge LLM to compare drifted prompts against baseline samples.
- Classify the drift type (e.g., “Emergence of a new topic,” “Shift in user intent,” “Increase in query complexity,” “Change in language style”).
- Route to appropriate response based on classification.
This two-layer approach transforms a statistical alert into an actionable diagnosis.
7. Cost Considerations for Drift Detection
Drift detection infrastructure itself has costs. The question is how to balance detection cost against the cost of undetected drift.
Cost optimisation strategies:
Tiered detection frequency. Monitor critical metrics continuously, secondary metrics hourly, tertiary metrics daily.
Sampled evaluation. Score a statistically meaningful sample (e.g., 5%) rather than 100% of traffic.
Adaptive thresholds. Use CFAR-inspired local thresholding that calibrates from recent behaviour, reducing false positives and unnecessary investigations.
Harmful vs. benign drift distinction. Not all drift requires retraining. Identifying DDLAs (Data Distributions with Low Accuracy) enables targeted retraining only when drift is actually harmful.
The cost of drift detection is always lower than the cost of undetected drift. For example, a model that degrades 1% per week for three months represents a 12% quality loss that could have been detected and corrected in week one.
8. Regulatory and Compliance Context
Drift detection is a regulatory requirement. In jurisdictions with binding AI legislation, post-market monitoring for performance degradation is mandatory for high-risk systems.
EU AI Act (Regulation 2024/1689):
- Article 72 mandates that providers of high-risk AI systems establish a post-market monitoring system that “actively and systematically collect[s], document[s] and analyse[s] relevant data… on the performance of high-risk AI systems throughout their lifetime”.
- The monitoring plan must be part of the technical documentation (Annex IV) and must enable evaluation of “continuous compliance” with the regulation’s requirements.
- Article 14 requires human oversight mechanisms, which intersect with drift response workflows. Humans must be able to intervene when automated systems detect degradation.
NIST AI RMF (MEASURE 2.4):
- The framework requires that “the functionality and behaviour of the AI system and its components are monitored when in production”.
- Suggested actions include “monitor and document how metrics and performance indicators observed in production differ from the same metrics collected during pre-deployment testing.” (“Measure – AIRC”)
Sector-Specific Obligations:
- Financial services: Model risk management principles (Federal Reserve, OCC, FDIC) require ongoing monitoring for AI models used in credit, fraud detection, and risk assessment.
- Healthcare: HIPAA Security Rule updates (January 2025) expect AI-enabled systems processing PHI to be included in risk analysis and security management processes.
- Insurance: As of January 2026, generative AI exclusions in Commercial General Liability policies place evidentiary burden on organizations to demonstrate how systems functioned and how risks were monitored.
Common Pitfalls: A Manager’s Drift Detection Red Flag Brief
Sources & Further Reading
- AWS Prescriptive Guidance. (2026). GenAI Lifecycle Operational Excellence. https://docs.aws.amazon.com/pdfs/prescriptive-guidance/latest/gen-ai-lifecycle-operational-excellence/gen-ai-lifecycle-operational-excellence.pdf
- Google Cloud. (2026). Introduction to Model Monitoring. https://docs.cloud.google.com/vertex-ai/docs/model-monitoring/overview
- Amazon Web Services. (2026). Amazon SageMaker Model Monitor. https://docs.aws.amazon.com/sagemaker/latest/dg/model-monitor-mlops.html
- Evidently AI. (2025). How to detect, evaluate and visualize historical drifts in the data. https://www.evidentlyai.com/blog/tutorial-3-historical-data-drift
- Evidently AI. (2025). Tutorial – Reports and Tests. https://docs-old.evidentlyai.com/tutorials-and-examples/tutorial_reports_tests
- KodeKloud. (2026). Model Monitoring in MLOps: Tools, Metrics & Best Practices. https://kodekloud.com/blog/model-monitoring-in-mlops/
- Arize AI. (2026). Embedding & Cluster Analyzer. https://arize.com/docs/ax/machine-learning/computer-vision/how-to-cv/embedding-and-cluster-analyzer
- Yurdakul, B. & Naranjo, J. (2020). “Statistical properties of the population stability index.” Journal of Risk Model Validation, 14(4), 89–100. — Supports discussion of the statistical properties of PSI thresholds
- Lin, J. (1991). “Divergence measures based on the Shannon entropy.” IEEE Transactions on Information Theory. — Original source for Jensen-Shannon Divergence
- Arize AI. (2026). Jensen-Shannon Divergence. https://arize.com/glossary/jensen-shannon-divergence/ — Supports the technical description of JS Divergence
- Arize AI. (2026). NVIDIA & Arize: Trustworthy Production AI. https://arize.com/partners/nvidia/
- Fiddler AI. (2026). Monitoring Charts. https://docs.fiddler.ai/observability/platform/monitoring-charts-platform
- ScienceDirect. (2026). SCCM: Stream Cruise Control Method for Automated Drift Detection and Adaptation. https://www.sciencedirect.com/science/article/abs/pii/S0020025526011552
- VLDB. (2024). Efficiently Mitigating the Impact of Data Drift on Machine Learning Pipelines. http://www.vldb.org/pvldb/vol17/p3072-dong.pdf
- NIST. (2022). Dear NIST AI RMF team: Comments on Operational Monitoring. https://www.nist.gov/system/files/documents/2022/05/19/Quintin%20McGrath.pdf
- ACM. (2025). Informed Adaptation: Drift Detection with PHT, ADWIN, and DDM. https://dlnext.acm.org/doi/pdf/10.1145/3748522.3779979
- Zhang, H., Huang, S.-L., Wang, Y., & Kuruoglu, E. (2026). Stable Spectral Copula Alignment for Robust Multimodal Learning. International Conference on Machine Learning (ICML) 2026, Poster 63712. https://icml.cc/virtual/2026/poster/63712
- LUMA-RAG: Lifelong Multimodal Agents with Provably Stable Streaming Alignment. arXiv preprint arXiv:2511.02371. https://ar5iv.labs.arxiv.org/html/2511.02371
- Regulation (EU) 2024/1689 of the European Parliament and of the Council. Article 72: Post-Market Monitoring by Providers and Post-Market Monitoring Plan for High-Risk AI Systems. EUR-Lex. https://eur-lex.europa.eu/eli/reg/2024/1689/oj
- Regulation (EU) 2024/1689 of the European Parliament and of the Council. Article 14: Human Oversight. EUR-Lex. https://eur-lex.europa.eu/legal-content/EN/TXT/?uri=CELEX:02024R1689-20260727
- National Institute of Standards and Technology. (2023). AI Risk Management Framework (AI RMF 1.0) – MEASURE 2.4: The functionality and behaviour of the AI system and its components are monitored when in production. AI RMF Playbook. https://www.stigviewer.com/controls/ai-rmf/MEASURE%202.4
- The Sedona Conference. (2025). AI Governance Principles. Working Group 13. https://www.reviewofailaw.com/Tool/Evidenza/Single/view_html?id_evidenza=3004
- Sekuj, V. (2026, August 16). Tired Of Alert Fatigue? Triage Agent Helps You Manage Your Alerts. Monte Carlo Blog. https://montecarlo.ai/blog-tired-of-alert-fatigue-triage-agent-helps-you-manage-your-alerts
- Monte Carlo. (2026). Slack AI. Monte Carlo Documentation. https://docs.getmontecarlo.com/docs/slack-ai
- Panther. (2026). Risk Scoring and Classification Framework. Panther Documentation. https://docs.panther.com/ai/risk-scoring-and-classification-framework
- McKay, H., Pérez Orozco, B., Garcia, F., Zilli, D., Mullins, B., Osborne, M., Roberts, S., & Sherman, N. (2026). Post deployment model drift detection. US Patent 12,530,726 B2. Google Patents. https://patents.google.com/patent/US12530726B2
- Panther Labs. (2026, March 31). AI-Powered Alert Triage for Modern SOC Teams. Panther Blog. https://panther.com/blog/ai-powered-alert-triage
This investigation is part of the MIAP (Managing Innovative AI Projects) framework, based on “Managing Innovative AI Projects” (Jayakumar K R and Prof. Alain Abran, 2025) and the AI Project Pulse newsletter series.
All trademarks, logos, and brand names mentioned are property of their respective owners. References are for identification, commentary, or education only. No endorsement or affiliation is implied.
© 2026, Jayakumar K R. All rights reserved.
This article and all its contents, whether in this form or any other form, format, or media shall not be copied, reproduced, distributed, adapted, translated, or quoted in whole or in part without the prior explicit written permission of the author. Unauthorized use, sharing, or reproduction of this material is strictly prohibited.