
The Observability Imperative: You Cannot Manage What You Cannot See
A misbehaving model degrades gradually. This happens through drops in accuracy, shifts in output quality, or changes in user behaviour. A misconfigured prompt causes regressions that only appear at scale. Degradations do not trigger an infrastructure alert.
Monitoring catches what is happening. Observability adds the ability to understand why. Without proper tracing, you end up guessing why an agent took a particular path. User complaints should not be your primary alert signal.
Investigation 2: Production Observability & Telemetry
Core Mandate
Building the telemetry infrastructure to see what the system is doing in production. This investigation owns the implementation of tracing, logging, and indicators collection across the full stack.
Why This Investigation Matters for Project Leaders
A system you cannot observe is a system you cannot trust. If your team cannot see what the model is doing in production, you cannot protect your users, your brand, or your bottom line.
Observability is not a dashboard you look at after an incident. Observability is the infrastructure that tells you an incident is happening before your users do. It is the difference between proactive incident response and reactive damage control.
This investigation addresses a fundamental management question. Have do we built the telemetry infrastructure to see what our AI system is doing in production, to diagnose why it is doing it, and to prove it is working as intended?
What to Investigate
1. Why Traditional Monitoring Breaks for AI Workloads
Traditional monitoring breaks for AI workloads in five critical ways.
- Outputs are probabilistic, not deterministic. A model can return a wrong answer with high confidence. Traditional error rates do not capture silent failures.
- Quality cannot be measured by latency alone. A fast response is not necessarily a good response. Groundedness, relevance, coherence, and safety require semantic evaluation, not just performance indicators.
- Failures are often silent and gradual. Drift, hallucination, and degradation occur without triggering infrastructure alerts. The system appears healthy while producing degraded outputs.
- Multi-step pipelines obscure root cause. In agentic systems, a failure at step 5 may originate from a retrieval error at step 2. Without distributed tracing, diagnosis requires guesswork.
- Cost is not just infrastructure cost. Token consumption, API calls, and GPU utilisation vary with prompt complexity and model choice. Traditional cost monitoring does not capture per-request inference economics.
2. The Observability Architecture: Three Principles
A robust monitoring architecture collects, links, and stores telemetry across data, model, and inference pipelines. Three principles are central:
Principle 1: Telemetry Must Be Standardised
Standardise indicators and labels across the fleet to enable aggregated checks. Standardisation enables:
- Cross-version comparison: Compare canary performance against baseline using identical indicatordefinitions.
- Fleet-wide aggregation: Roll up indicators across multiple deployments, regions, or tenants.
- Alerting consistency: Define alert thresholds once, apply them everywhere.
OpenTelemetry has emerged as the de facto standard for distributed systems observability. The OpenLIT SDK automatically generates distributed traces and indicators to provide insights into each agentic event.
Principle 2: Observability Must Enable Diagnosis
Monitoring catches what is happening; observability adds the ability to understand why. A dashboard that shows “latency increased” is monitoring. A trace that shows “latency increased because the retrieval step added 400ms and the LLM call retried three times due to rate limiting” is observability.
Diagnosis requires:
- Distributed tracing: Follow a request across all components: retrieval, LLM call, tool invocation, response assembly.
- Correlation IDs: Link traces, logs, and indicators to a single request or session.
- Contextual attributes: Attach model version, prompt version, user segment, and configuration to every span.
Principle 3: Telemetry Must Be Actionable
Telemetry that does not trigger action is noise. Every trace must be queryable when an incident occurs.
Actionability requires:
- Alert-to-runbook linkage: Every alert references a specific runbook that defines the trigger, steps, validation, and communication plan.
- Threshold definition: Indicators have defined thresholds based on baseline behaviour, not arbitrary values.
- Ownership assignment: Every alert has a named owner responsible for response.
3. Key Telemetry Dimensions for AI Systems
The following telemetry dimensions apply across Traditional ML, GenAI, and Agentic AI systems, with system-specific variations noted.
3.1 Latency
Latency directly affects user experience. A slow response degrades trust even if the output is correct.
Traditional ML: Latency is primarily inference time. p99 latency matters for real-time prediction systems.
GenAI/LLM: Latency includes time-to-first-token (TTFT) and time-per-output-token (TPOT). Streaming responses require separate indicators for first-token latency and total generation time.
Agentic AI: Latency is end-to-end trajectory time, including planning, tool calls, LLM invocations, and response assembly. Each step requires its own latency measurement to identify bottlenecks.
3.2 Accuracy Proxies
Measurable indicators of output quality where ground truth is not immediately available.
Traditional ML: Indicators such as Accuracy, precision, recall, F1, RMSE are computable when labels are available. For production monitoring, proxy indicators include prediction distribution shift and confidence calibration.
GenAI/LLM: Per-rubric evaluation scores (Groundedness, Relevance, Coherence, Safety). These require LLM-as-judge or human evaluation. Online evaluation can sample a fraction of live responses (e.g., 5%) for continuous quality monitoring.
Agentic AI: Trajectory-level indicators: task completion rate, tool call accuracy, containment (1 − False Resolution). Replay auditing against historical trajectories provides a verification mechanism.
3.3 Error Rates
Error rates are the first signal of system degradation. A spike in guardrail trips may indicate prompt drift or adversarial input.
Traditional ML: Prediction failures, timeouts, input validation errors, feature retrieval failures.
GenAI/LLM: Guardrail trip rate, content policy violations, rate limiting, context length exceeded, provider API errors.
Agentic AI: Tool call errors, loop detection (agent stuck in repetitive cycles), memory retrieval failures, planning failures, communication protocol errors.
3.4 Resource Indicators
Resource indicators related to Infrastructure utilisation and throughput explain latency and cost. A latency spike may be caused by GPU saturation, not model degradation.
Traditional ML: CPU/GPU utilisation, memory usage, throughput (predictions/second), batch size efficiency.
GenAI/LLM: GPU utilisation, KV cache utilisation, memory bandwidth, token throughput, queue depth. Disaggregated inference (prefill/decode separation) requires separate resource monitoring for each phase.
Agentic AI: Multi-container orchestration resource usage, agent loops, tool execution, supporting services. Each component requires its own resource monitoring.
3.5 Cost and Token Tracking
Uncontrolled token consumption can make a technically successful deployment economically unsustainable which warrant tracking per-request and aggregate cost of inference.
Traditional ML: Inference cost per prediction, GPU cost per hour, amortised model training cost.
GenAI/LLM: Token counts (input, output, cache read, cache creation), API costs per model provider, cost per request. OpenTelemetry GenAI semantic conventions define standard indicators for token usage (gen_ai.client.token.usage).
Agentic AI: Token costs per trajectory step, tool invocation costs, cumulative cost per task. Loop detection prevents runaway token consumption.
3.6 Full Sequence Visibility (Agentic Systems)
Agentic failures often originate in intermediate steps. Without full sequence visibility, root cause analysis is impossible.
Indicators: End-to-end trace of a request from user query through planning, tool invocations, LLM calls, and final responses.
Observability Guidance: Distributed tracing with parent-child span relationships. A root span represents the user request; child spans represent planning, tool calls, and LLM invocations. Correlation IDs link traces to user sessions.
3.7 Behavioural Troubleshooting
Understanding why an agent took a particular path is often more valuable than knowing what path it took. Behavioural troubleshooting enables prompt refinement, tool configuration, and guardrail adjustment.
Indicators: Observability of agent reasoning paths and tool usage.
AgentTrace provides a dynamic observability framework that enables continuous, introspectable monitoring of LLM agents through structured logging across operational, cognitive, and contextual dimensions.
Panopticon is a distributed observability framework designed to make LLM-based applications more transparent and easier to debug, combining semantic provenance tracing with LLM-assisted analysis to automatically spot issues.
4. Observability Architecture by System Type: Traditional ML, GenAI, and Agentic AI
The telemetry dimensions apply across all AI systems, but the operational mechanics differ significantly across system types. The table below maps core observability decisions to the three system types.
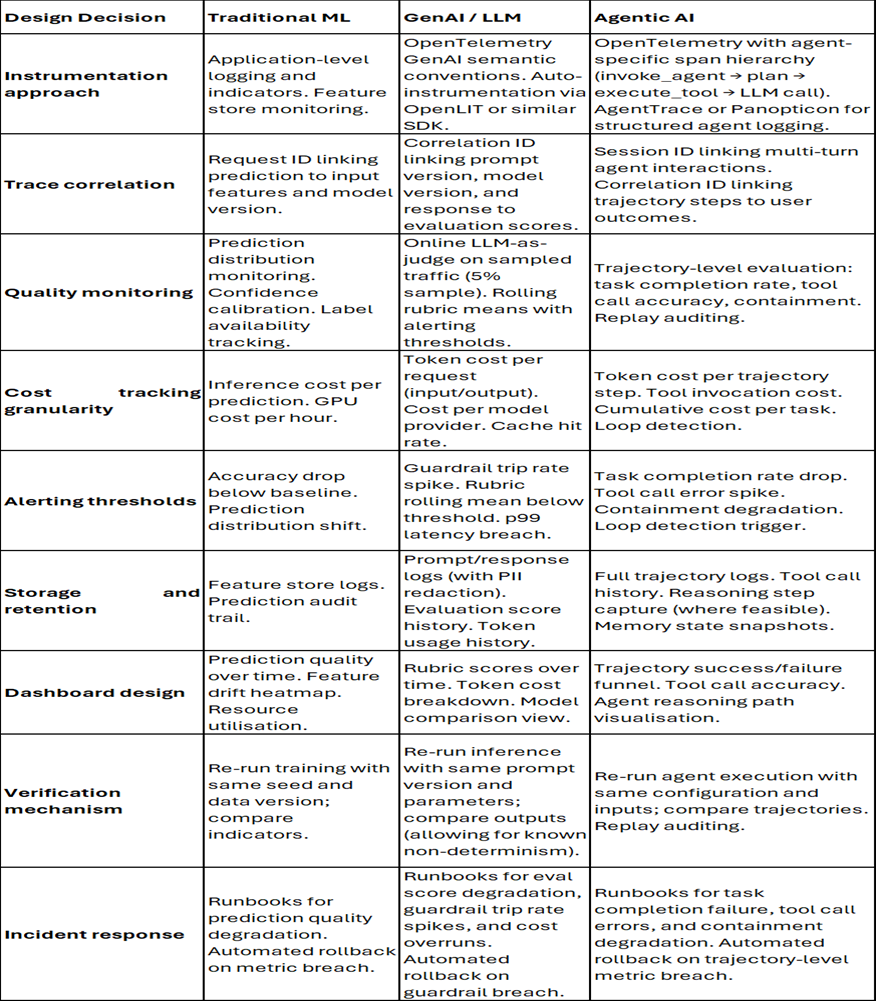
They determine whether you can see what your system is doing, diagnose why it is doing it, and prove it is working as intended.
5. The Telemetry Implementation Pattern: From Definition to Signal
A telemetry implementation has four components:
- Instrumentation: How is the indicator emitted? (e.g., OpenTelemetry span attribute, custom metric, log entry)
- Aggregation: How is the indicator rolled up? (e.g., percentile calculation, rolling mean, count)
- Threshold: What triggers an alert? (e.g., p99 latency > 5s, Groundedness rolling mean < 0.85)
- Action: What happens when the threshold is breached? (e.g., alert on-call, trigger automated rollback, log for review)
Instrumentation Patterns
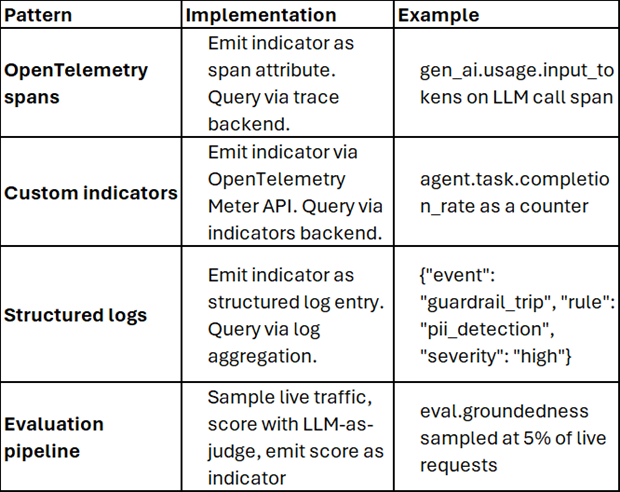
The telemetry implementation pattern must connect all four components—instrumentation, aggregation, threshold, and action—for every indicator that matters.
6. Observability for Agentic Systems: Special Considerations
Agentic systems introduce observability challenges that do not exist in traditional ML or simple GenAI applications.
6.1 Non-Deterministic Trajectories
An agent may take different paths to the same goal depending on context, tool availability, and LLM sampling. Observability must capture the trajectory, not just the outcome.
Observability Guidance: Full sequence tracing with parent-child spans for every planning step, tool call, and LLM invocation.
6.2 Tool Call Variability
Tool calls may fail, retry, or return unexpected formats. Observability must capture tool inputs, outputs, errors, and latency.
Observability Guidance: Span attributes for tool name, input parameters, output, error type, and duration. GenAI semantic conventions define gen_ai.tool.* attributes for this purpose.
6.3 Memory Persistence
Agent memory may outlive a single request. Observability must capture memory state at each step to enable replay auditing.
Observability Guidance: Memory snapshots logged with correlation ID. Replay capability for historical trajectories.
6.4 Silent Path Failures
An agent may complete a task with a plausible but incorrect result. The failure is silent because no exception is raised.
Observability Guidance: Outcome-based evaluation (task completion rate, containment) in addition to process-based monitoring. Replay auditing against historical trajectories to detect silent degradation.
7. Best Practices for Agentic Observability
- Attribute inputs including data retrieval sources, model versions, prompt versions, and user/session identifiers. Without input attribution, you cannot reproduce a failure.
- Log actions and tool calls, including parameters and results for every tool invocation. Tool call history is essential for debugging agent behaviour.
- Capture intermediate reasoning steps where feasible, logging planning decisions and reasoning traces. This enables behavioural troubleshooting and prompt refinement.
- Tag outcomes with success/failure labels, business context, and user satisfaction signals. Outcome tagging enables continuous improvement cycles.
- Record guardrail decisions, including which guardrails were triggered, which were overridden, and by whom. Guardrail decisions are governance evidence.
8. Cost Considerations for Observability Infrastructure
Observability infrastructure itself has costs. The question is not whether to invest in observability; the question is how to balance observability cost against the cost of undetected failures.
Cost optimisation strategies:
Sample evaluation traffic: Rather than scoring every live response, assess a representative 5% sample. This is typically sufficient to produce a reliable rolling indicator metric at a fraction of the evaluation cost.
Tiered retention: Retain full traces for recent data, aggregate indicators for historical data. Full traces are expensive; aggregated indicators are cheap.
Sampled tracing: Trace 100% of errors, sample successful requests. Error traces are most valuable for debugging.
Self-hosted observability: OpenLIT and similar tools are self-hostable, avoiding per-seat or per-request pricing from commercial observability vendors.
Common Pitfalls: A Manager’s Observability Red Flag Brief
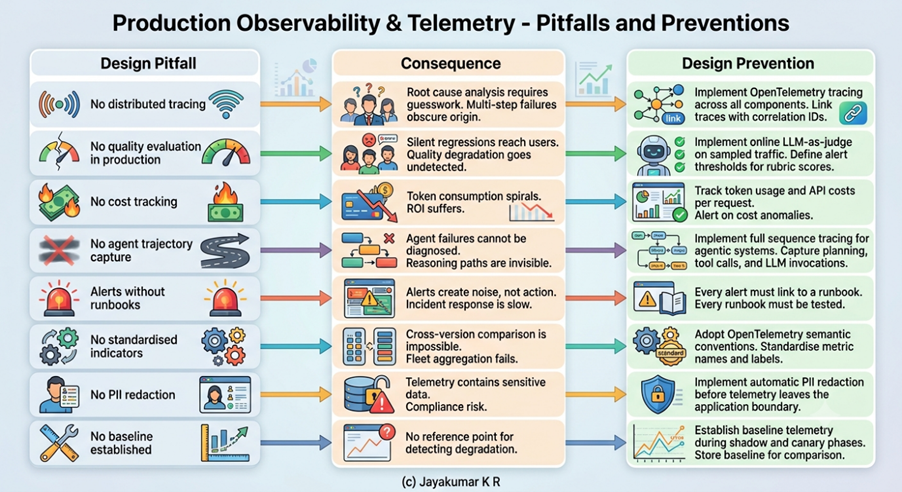
References
- OpenTelemetry GenAI Semantic Conventions. https://opentelemetry.io/docs/specs/semconv/gen-ai/
- OpenLIT. (2026). Monitor Claude using OpenTelemetry. https://docs.openlit.io/latest/sdk/integrations/anthropic
- AlSayyad, A., Huang, K., & Pal, R. (2026). AgentTrace: A Structured Logging Framework for Agent System Observability. ArXiv, abs/2602.10133.
- Mandada, H. (2026). Panopticon: A Distributed Observability Framework for Debugging Large Language Model Pipelines. 2026 IEEE International Conference on Interdisciplinary Approaches in Technology and Management for Social Innovation (IATMSI).
- OpenLIT. (2026). OpenLIT Overview. https://docs.openlit.io/latest/overview
- CodeCrunchWorldwide. 2026. Eval in Prod: Deploys and On-Call. GitHub. https://github.com/codecrunchworldwide.
- OpenTelemetry. (2026). genai package — Go Packages. https://pkg.go.dev/github.com/docker/docker-agent/pkg/telemetry/genai
- FutureAGI. (2026). LLM Eval with Shadow Traffic and Canary Deployment in 2026. https://futureagi.com/blog/llm-eval-shadow-traffic-canary-2026/
- KodeKloud. (2026). Shadow Deployment for Model Evaluation. AWS Certified Machine Learning Engineer Associate.
- Vultr Blogs. (2026). Why Daily AI Deployments are Rare — and How Platform Teams Can Fix That. https://blogs.vultr.com/cncf-annual-survey-daily-ai-platform-engineering
This investigation is part of the MIAP (Managing Innovative AI Projects) framework, based on “Managing Innovative AI Projects” (Jayakumar K R and Prof. Alain Abran, 2025) and the AI Project Pulse newsletter series.
This article combines established industry practices, findings reported in research papers and industry publications, vendor documentation, and the author’s professional analysis. While references have been provided where available, not all recommendations described herein have been independently validated through peer-reviewed research. Some practices represent emerging approaches that have gained adoption within the industry but continue to evolve as technologies, operational experience, and governance expectations mature. Readers should therefore use the material as educational guidance and adapt it to their specific organizational, technical, and regulatory context.
All trademarks, logos, and brand names mentioned are property of their respective owners. References are for identification, commentary, or education only. No endorsement or affiliation is implied.
© 2026, Jayakumar K R. All rights reserved.
This article and all its contents, whether in this form or any other form, format, or media shall not be copied, reproduced, distributed, adapted, translated, or quoted in whole or in part without the prior explicit written permission of the author. Unauthorized use, sharing, or reproduction of this material is strictly prohibited.